
RF Spectrum Trace
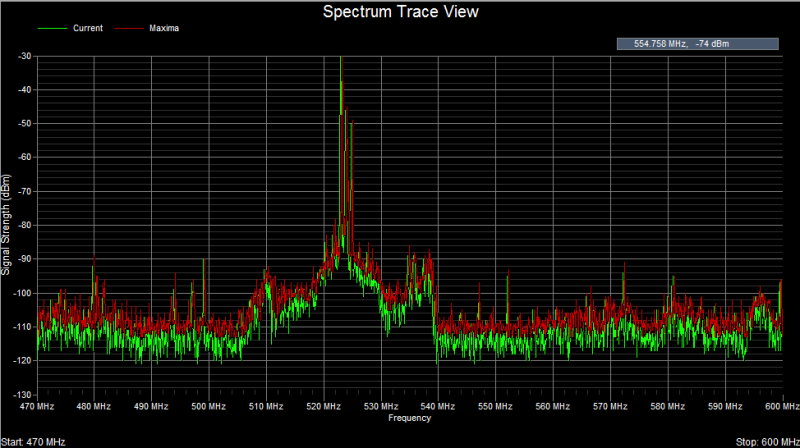
Continuously scans and samples the signal strength (dBm) of RF transmissions within the specified frequency range. By default 3 traces are displayed — Current (green), Maxima (red) and Active (gray). The Current trace displays the signal strength data from the most recent scan, the Maxima trace displays the maximum signal strength for each frequency since the scan session began (similar to a ‘Peak and Hold’ function), and the Active trace displays real-time data as the RF Explorer device is actively scanning. Optionally, a Reference (blue) trace may also be displayed.
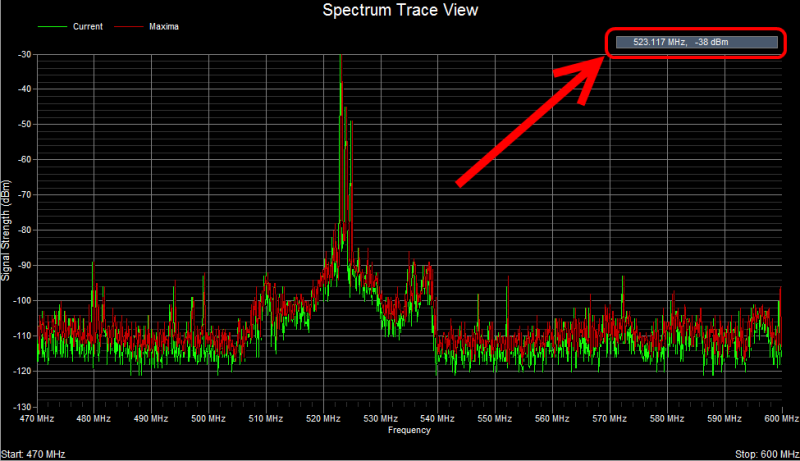
In the upper-right-hand corner of the Spectrum Trace view there is a small rectangle that displays the current [x,y] grid coordinates in MHz and dBm. As you move the mouse cursor around the chart, these coordinates are continuously updated.
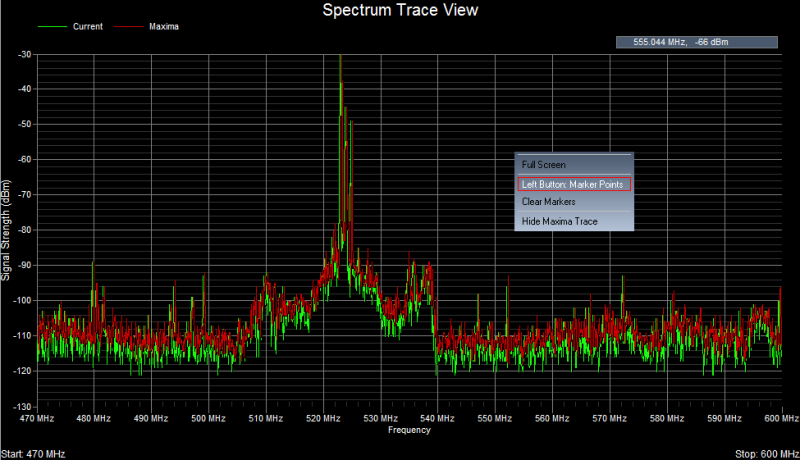
When you right-click the mouse button, a popup menu appears with several choices you can select from:
◦ ‘Region-Of-Interest’ (ROI) using the left mouse button
◦ Create Marker points or ‘Hot Spots’ using the left mouse button
◦ Full Screen view
◦ Clear Markers and ROI outline from the display
◦ Hide Maxima Trace
◦ Hide Reference Trace
These choices are discussed further below:
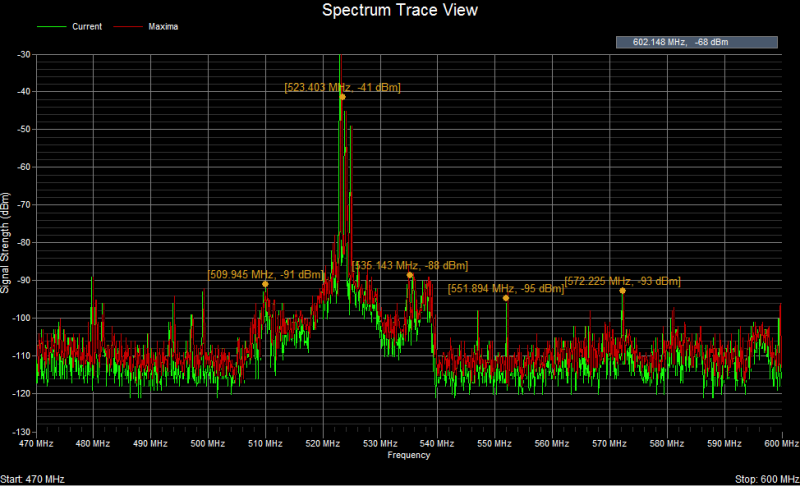
Left Button used for creating Marker points or ‘Hot Spots’:
When you select Left Button: Marker Points from the popup menu then subsequent left-clicks create Marker points or Hot Spots that display the corresponding frequency (in MHz) and signal strength (in dBm) for the location in the grid that you just clicked on.
Full Screen view:
When you select Full Screen from the popup menu, the Spectrum Trace view will enlarge to fill the entire screen, and the two lower windows will become minimized. To restore the Spectrum Trace view to its original dimensions, access the popup menu by right-clicking the mouse and select Restore Screen.
Clear Markers and ROI outline from the display:
If the Spectrum Trace view becomes too cluttered with Markers, then these can be removed from the display by selecting Clear Markers from the popup menu.
Hide Maxima Trace:
When you select this option from the popup menu then the Maxima trace is no longer displayed. If the Maxima trace is currently hidden and you wish to display it again, then from the popup menu select Show Maxima Trace and it will once again be displayed in the view.
Hide Reference Trace:
When you select this option from the popup menu, the Reference trace will no longer be displayed. If the Reference trace is currently hidden and you want it to be displayed again, then select Show Reference Trace from the popup menu. In order to show a Reference trace it is first necessary to save a trace to a file.
Wireless Diagnostics & Troubleshooting